EdTech Evidence Exchange Platform Milestone: Over 1,000 Educator Experiences Documented and Shared!
In April 2022, the EdTech Evidence Exchange hit an important milestone. Over one thousand educators have now contributed their experiences with specific education technology products to the EdTech Evidence Exchange Platform. The lessons learned by these educators are now available to support other educators’ edtech selection and implementation decisions. We compensated each of these educators who took the time to share their experiences with technologies to benefit educators across the nation.
Cue trumpets, balloons, and much more work to come!
Get me up to speed. What is the EdTech Evidence Exchange Platform?
The EdTech Evidence Exchange Platform, fondly known as the Exchange Platform, is a data collection, analysis, and display platform we are building to help educators nationwide learn from each other’s edtech experiences.
Educators contribute to the Exchange Platform by completing two research surveys. Our first survey asks about their school and district environments, also known as their implementation contexts. We developed this first survey through the EdTech Genome Project, and it measures ten important context features that likely explain why edtech products can succeed in one school yet fail in another. 1
Our second survey collects educator experiences with a specific edtech product. Educators tell us information such as how students use that particular product, how much time they spend planning for and implementing that product, and how students feel about the product. Educators report whether they are seeing improvements in instruction, student engagement, and student learning. They also provide recommendations for other educators considering the product.
Importantly, we provide financial compensation to each educator who takes the time to share their experiences.
Once an educator contributes to the Exchange Platform, we give them access to all of the experiences reported by their peers. This means that educators who take the time to document their own experiences are able to do several things.
- Educators can review aggregate reports of their district peers’ experiences. When several dozen educators in a school or district take our surveys, patterns quickly become visible. For example, do a majority of teachers report that they are overwhelmed by too many competing initiatives? How do they collectively feel about the planning time and professional development for a product they are required to use?
- Educators can learn from the experiences of their peers nationwide who work in similar schools and district contexts. Educators see which products work well in those schools and districts and can read the guidance provided by their peers who may be thousands of miles away but face similar contextual challenges.
- Educators can review aggregate reports about individual edtech products. These reports continually improve as more educators describe their experiences. They help all of us to understand which products perform best in which contexts – and what we can each do to maximize the chances of successful implementation.
During the initial phase of our work the Exchange Platform is focused on educators’ experiences with math products. That will expand over time and is dependent on philanthropic funders.
Who are the first 1,000 educators to contribute to the Exchange Platform?
The first 1,000 educators include 878 teachers, 83 school leaders, and 39 district leaders who represent 132 different districts or charter organizations. These educators work in geographically and racially diverse contexts. 2
What are a few early insights from 1,000 educator experiences?
Educator’s EdTech Implementation Contexts
First, let’s look at the first 1,000 educators’ school and district contexts. Educators and their students have strong access to technology but receive varied support for that technology both at school and remotely.3
Teachers are infrequently involved in school-level technology decisions but somewhat more involved in classroom-level decisions.4 Large standard deviations illustrate a lot of variation in involvement across educators working in different school districts. When we ask educators about selection processes, 41% report they are never or almost never involved in technology selection, and an additional 42% are only occasionally involved. So, it’s not surprising that when we ask more specific selection questions, approximately ⅓ of educators respond that they “don’t know.” This is a key area for future work— supporting educators’ involvement in technology decisions.
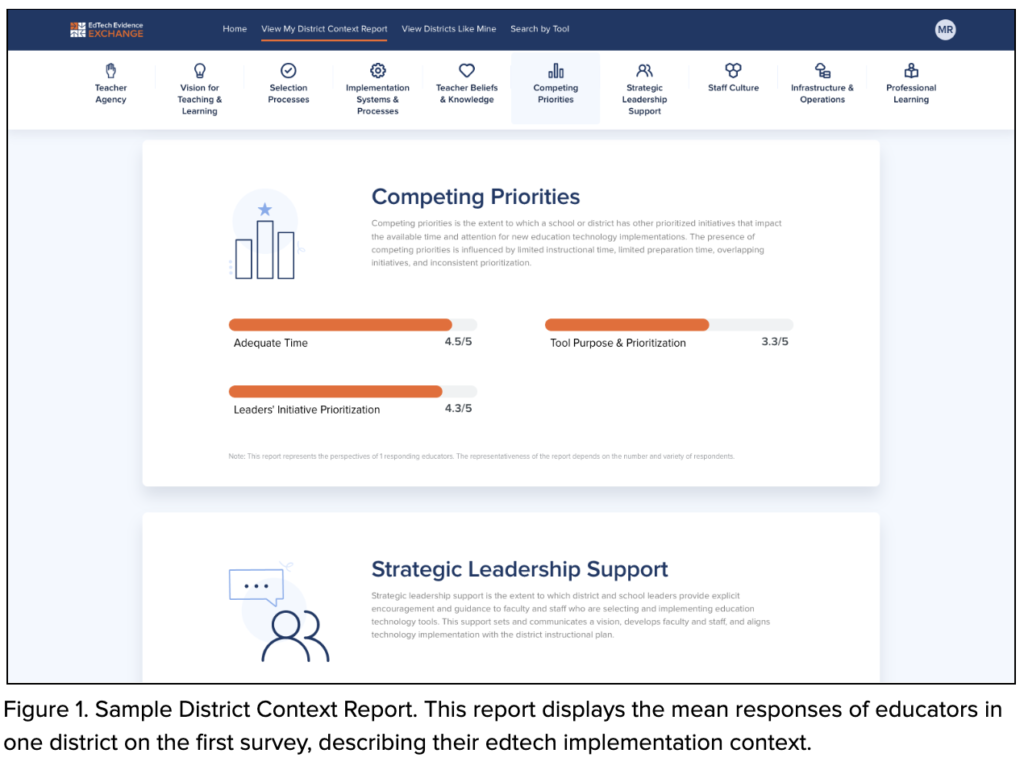
These data represent implementation contexts across the country and give a glimpse of some trends in district implementation contexts. Context data are also valuable when you examine evidence within one district. For example, in one district, a number of educators do not feel they have sufficient time for the selected technologies. However, they feel more positive about the extent to which each technology has a unique purpose and that they know where to focus attention.5 With this information, district leaders can focus improvement efforts to enhance their edtech implementation context, such as explicitly incorporating support for timing lessons into the tool’s professional development. The platform displays average context data by district to highlight these opportunities for growth.
Educator’s EdTech Implementation Experiences
The first 1,000 educators to contribute their experiences to the Exchange Platform each reported on one math technology in use at their school. In total, they reported on 83 different math tools, including i-Ready (171), ST Math (118), IXL (97), EnVision (72), and Imagine Learning Math (41). These five programs represent approximately 50% of the reports.

Looking across the 83 technologies, educators have pretty positive perceptions (approximately 7 on a 10-point scale) about improvements to instruction, student engagement, and student outcomes. However, 15% of educators reported perceiving little or no benefit to students.6
Educators are also generally positive when asked if they would recommend various technologies to educators who work in similar districts.7 But, for specific technologies, the extent to which educators would recommend it to someone in a similar district varies across districts. This suggests that not all technologies are a good fit for a specific context. It is key to examine and compare educators’ perceptions about specific technologies in specific contexts, which the Exchange Platform allows users to do. As we gather more educators’ experiences, we will be able to more accurately pinpoint which technologies are likely to succeed in which contexts.
Educators don’t just quantify their experiences. They also describe what works for them and what doesn’t. When describing features that support student learning across technologies, educators overwhelmingly and positively discuss features that either use guided and independent practice or a discovery approach to review and allow students multiple attempts to solve problems. However, a few educators also identify negative elements of technologies, such as not requiring students to explain their math thinking, and some identify that they do not attribute improvements in learning to the technology at all.
When asked for advice to offer to other educators using the tool, they overwhelmingly recommend that it is worth it to invest time in learning features of technologies before using it with students. Educators give explicit advice such as…
- Make sure you learn the tool yourself and try a demo student account…
- Plan the time to complete the trainings instead of trying to “wing it” and make it a priority to utilize it regularly to build comfort for kids.
- Learn how to access the data so you can challenge students more effectively and so students can work at their own independent learning level
- Utilize the collaboration tools and ask for help if you need it. The program seems overwhelming because there are a lot of moving parts, but it’s really easy to make your own materials. Also use the “clone” tool to save yourself some time instead of rewriting all your problems every time.
This is just a taste of the data currently in the platform, and that platform data is available right now to educators who contributed their own experiences.
What does it take to collect 1,000 educator experiences?
In short, a lot.
In spring 2021, we launched the Exchange Platform for beta testing and data collection. Although we have conducted formal research since 2018, this was the first time we collected data via the Exchange Platform. In summer 2021, we used these data to revise the platform. We looked closely at educators’ responses, particularly about their experiences with technology, and revised our survey questions to improve clarity and ensure each question sought unique information. These data were incredibly valuable for informing the surveys and platform, but they aren’t part of our first 1,000 educators’ data now in the platform
In fall 2021, we opened our virtual doors and launched Version 1 of the Exchange Platform, beginning with a clean slate and an empty database. We partnered with three states to recruit school district partners: Alabama, Nevada, and Utah. We also partnered with the National Council of Teachers of Mathematics and attended their regional convening in March 2022, and collected data in partnership with IDEA at IDEAcon and with UCET at their annual conference.
While we would love to say it was smooth sailing from day one, that just wasn’t the case. The 2021-2022 school year presented incredible challenges for educators, as they navigated staffing shortages, increasing student mental health concerns, and inequitable impacts of COVID-19 closures, to name a few.
The evidence in the Exchange Platform can help educators plan for efficient and effective technology-enhanced instruction, but it does require an upfront time investment of approximately 45 minutes from each educator. Although we compensate educators for contributing to the Exchange Platform, it is even more critical to build buy-in for the value of this nationwide effort to unlock educators’ edtech experiences and expertise. This work is not easy, but it is worth it.
What’s next?
Collecting evidence on 1,000 educators’ technology experiences is an important milestone, but it is just the beginning. The Exchange aims to collect rich evidence on edtech implementation from a representative sample of the more than 3 million educators in the United States.
The entire education ecosystem will benefit from access to this evidence. Educators can learn from each other at scale as they dramatically improve their edtech selection and implementation. Companies who create powerful edtech tools can begin to understand why their products’ performance varies so much from one district to another – and how to help every district maximize the impact of the products they procure on student outcomes.
Collecting, analyzing, and disseminating all of this data is hard work and requires individual engagement with tens and eventually hundreds of thousands of educators. The EdTech Evidence Exchange is a nonprofit and currently relies on philanthropy to exist as we seek to collect evidence from which everyone will benefit but no one is incentivized to document. As edtech spending continues to expand, there is an increasing need to increase the federal funding allocation for education technology research, but we are not there yet.
The Exchange team is hard at work fundraising to support this effort, building partnerships to engage new educators, sharing insights along the way, and iterating on the Exchange Platform to best meet educator needs. We are just getting started and can’t wait for what’s to come.
Notes
1 Vision for Teaching & Learning, Selection Processes, Infrastructure & Operations, Implementation Systems & Processes, Strategic Leadership Support, Teacher Agency, Teacher Beliefs & Knowledge, Professional Learning, Staff Culture, and Competing Priorities
2 Locales: City (26%), Suburban (38%), Town (15%), Rural (21%); Average Student Populations Served: 0.6% American Indian or Alaskan Native Mean (SD) = 0.6% (1%), Asian Mean (SD) = 3% (6%), Black Mean (SD) = 13% (21%), Hispanic or Latino Mean (SD) = 18% (18%), Native Hawaiian or Other Pacific Islander Mean (SD) = 0.4 % (0.8%), White Mean (SD) = 60% (28%), 2 or more races Mean (SD) = 4% (4%); Educator Gender Identification: Female (88%), Male (11%), and Non-binary (<1%); Teaching Format: In-person (95%), Remote (2%) or Blended (2%); Grade Level: Early childhood (15%), Elementary (53%), Middle school (21%), High school (16%), All grade levels (6%)
3 As reported by educators on a scale of 1 to 5, School Device Access & Functionality: Mean (SD) = 4.1 (0.5); School Support: Mean (SD) = 3.4 (0.9); Remote Support: Mean (SD) = 3.1 (1.1)
4 As reported by educators on a scale of 1 to 5, Teacher Involvement in School-level Decisions: Mean (SD) = 2.6 (1.0); Teacher Involvement in Classroom-level Decisions: Mean (SD) = 3.3 (1.1)
5 As reported by educators on a scale of 1 to 5, Adequate Time: Mean (SD) = 2.8 (0.9); Tool Purpose & Prioritization: Mean (SD) = 3.5 (0.6)
6 As reported by educators on a scale of 1 to 10, Success in Terms of Instruction/Learning Experiences: Mean (SD) = 7.0 (1.9), Success in Terms of Student Engagement: Mean (SD) = 7.1 (2.0), and Success in Terms of Student Outcomes: Mean (SD) = 7.1 (1.7). 15% of educators rate Success in Terms of Student Outcomes as 5 or below
7 As reported by educators on a scale of 1 to 10, Likeliness to Recommend Product to Educator in Similar Context: Mean (SD) = 7.5 (2.3)